Functions | |
| spline approximation | parameter (distance from corner to spline) approx_e |
| cos (a2/180 *pi) sin(a2/180 *pi) | |
| approx_e (i) | |
| figure (2) | |
| else | plot (polyval(px, t), polyval(py, t), '.') |
| end | figure (1) |
| plot (angles, approx_e) | |
| grid | title ('Distance from corner to spline-approximation parameter') |
| xlabel ('Angle[deg]') | |
| ylabel ('e') | |
| plot (angles, my_e, 'r') | |
Variables | |
| clear | all |
| clc | |
| angles = 5:5:180 | |
| m = zeros(size(angles)) | |
| a1 = 0 | |
| B = 4.4 | |
| A = 6860 | |
| distance = 1 | |
| for | i = 1:length(angles) |
| for | a2 = angles(i) |
| p | |
| x0 = p(1,1) * distance | |
| y0 = p(1,2) * distance | |
| x1 = p(3,1) * distance | |
| y1 = p(3,2) * distance | |
| xx0 = m*(p(2,1) - p(1,1)) | |
| yy0 = m*(p(2,2) - p(1,2)) | |
| xx1 = m*(p(3,1) - p(2,1)) | |
| yy1 = m*(p(3,2) - p(2,2)) | |
| px | |
| py | |
| for | t |
| end end hold | on |
| hold on | c0 = 0.892303 |
| c1 = -0.008169 | |
| c2 = 1.848555E-05 | |
| my_e = (c2*angles.^2 + c1*angles + c0) * distance | |
Function Documentation
| approx_e | ( | i | ) |
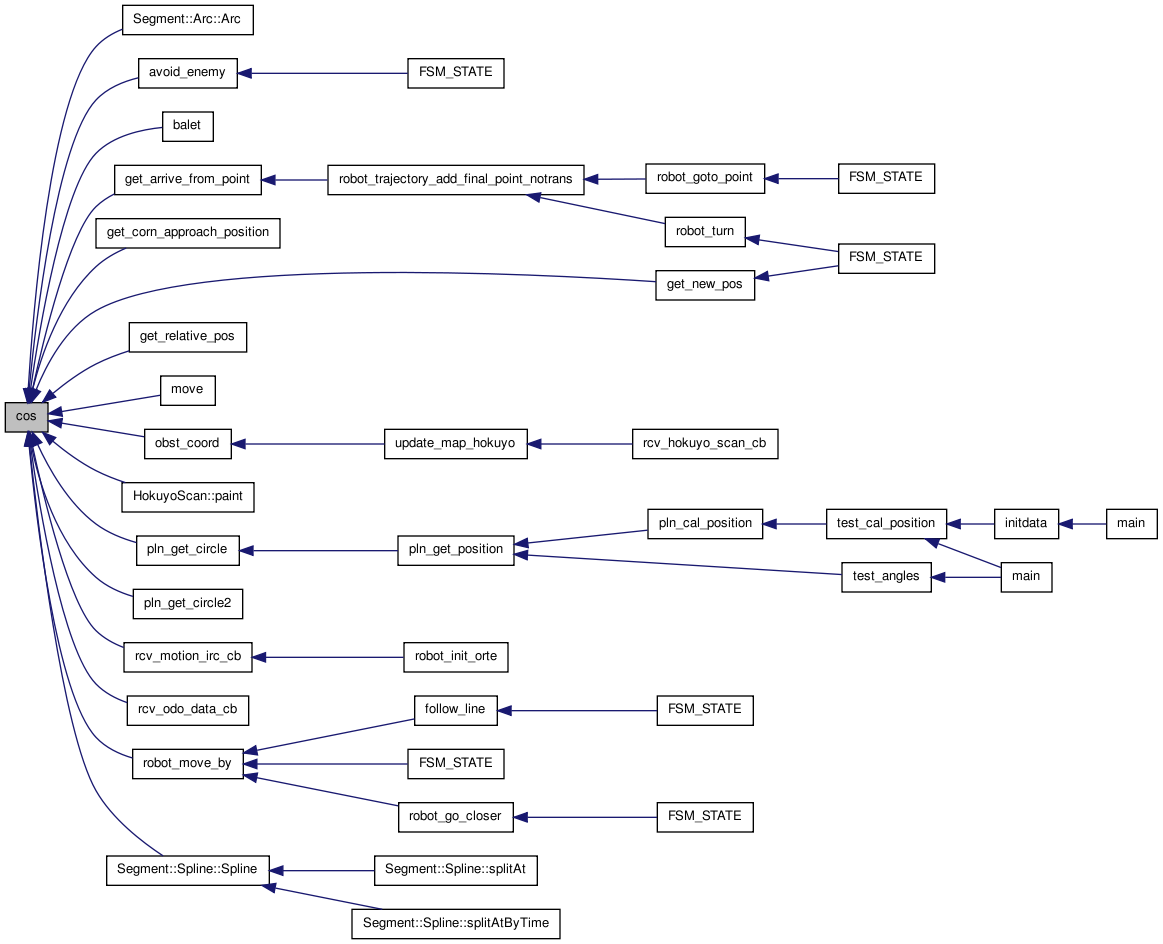
| cos | ( | a2/180 * | pi | ) |
Here is the caller graph for this function:
| vykresleni splinu z naseho interpolatoru Coordmv figure | ( | 2 | ) |
| spline approximation parameter | ( | distance from corner to | spline | ) |
| plot | ( | angles | , | |
| approx_e | ||||
| ) |
| grid title | ( | 'Distance from corner to spline-approximation parameter' | ) |
| xlabel | ( | 'Angle' | [deg] | ) |
| ylabel | ( | 'e' | ) |
Variable Documentation
| A = 6860 |
| a1 = 0 |
| close all |
| angles = 5:5:180 |
| B = 4.4 |
| c1 = -0.008169 |
| c2 = 1.848555E-05 |
| distance = 1 |
| m = zeros(size(angles)) |
| hold on |
Initial value:
Initial value:
 [
       -3*xx1-3*xx0-6*x0+6*x1
      7*xx1+8*xx0+15*x0-15*x1
     -4*xx1-6*xx0-10*x0+10*x1
                            0
                          xx0
                           x0]
Initial value:
 [
       -3*yy1-3*yy0-6*y0+6*y1
      7*yy1+8*yy0+15*y0-15*y1
     -4*yy1-6*yy0-10*y0+10*y1
                            0
                          yy0
                           y0]
| zvetseni rastru x0 = p(1,1) * distance |