Overview
Boost-statechart-viewer is a program for visualization of state machines written in C++ with boost/statechart library. The program itself is written in C++ and uses clang from LLVM project for analyzing the source code. This program is released under the GNU GPL license.
NEWS
- 2014-03-10 Updated to work with clang/llvm 3.3 and 3.4. Thanks Jan Rueegg.
- 2013-05-16 Script for generating is able to work with more source files and treat them as one state machine.
- 2013-04-05 The program is working with LLVM and Clang version 3.0 or higher
- 2012-07-11 We have got a new mailing list.
Authors
Petr Silhavik, Michal Sojka. You can contact us using a mailing list at boost-statechart-viewer@rtime.felk.cvut.cz.
Status
- The program can found states and transitions in the source code.
- The program understands all options and flags as the compilers (gcc, clang, ...). The syntax analysis is done by compiler clang.
- State machines can be defined in more than one file.
- All states and their implementations must be directly accesible from file that is used as input for viewer.
- Program provides diagnostics of state machines eg. event usage, missing typedefs for reactions.
For compiling and correctly working program it is necessary to have LLVM and clang version 3.3 or higher.
Usage
The program is plugin for compiler clang. The produced output file has the same name as the input file with source code. It is also possible to use script that also produces the state diagram in format pdf. It can be also found in repository. This script is able to work with more C++ files and treat them as one state machine. This option can be accesed by using -link as first parameter. The other parameters should be all files that are used for compilation of state machines (e.g. .cpp, .cc). If this option is not used state diagram is generated for all files independently.
Example of command line invocation:
clang++ -Xclang -load -Xclang visualizer.so -Xclang -plugin -Xclang visualize-statechart -c file.cpp
The output file can be transformed into the picture using classical
dot commands (e.g. dot -Tpng graph.dot -o graph.png) . The initial
state is double outlined. Each transition has a label with the name of
the triggering event.
Download:
Boost statechart viewer can be downloaded from GIT repository.
git clone git://rtime.felk.cvut.cz/boost-statechart-viewer.git
You can also browse the repository online.
Gallery
Small
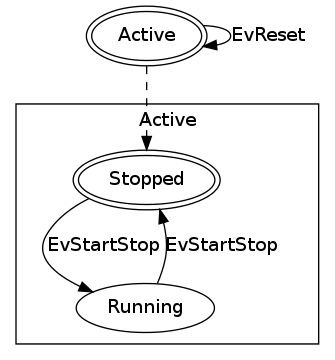
StopWatch
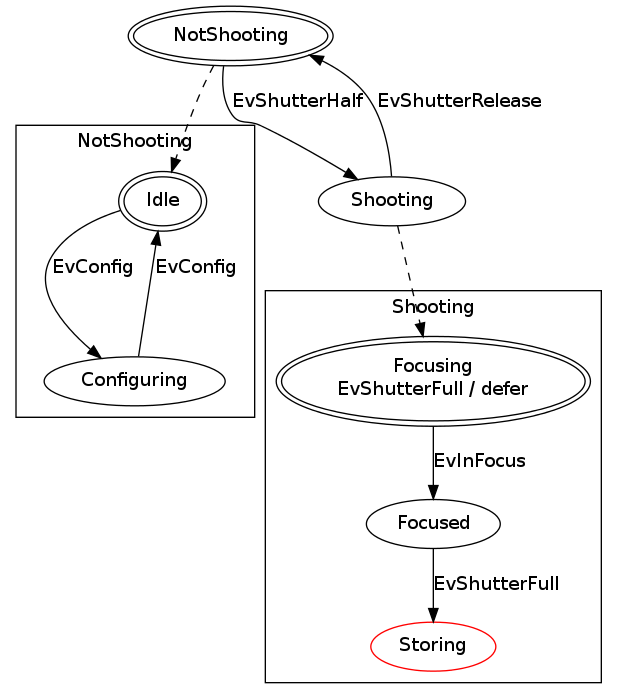
Camera
- Camera example from boost statechart library
- State Storing is red because it has no typedef for reactions and it can be error produced by programmer